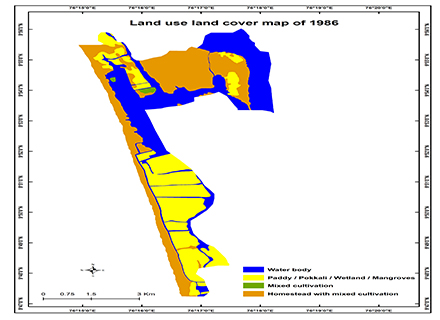
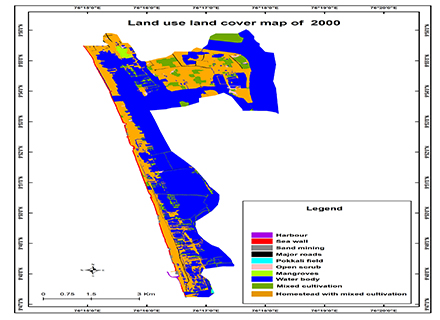
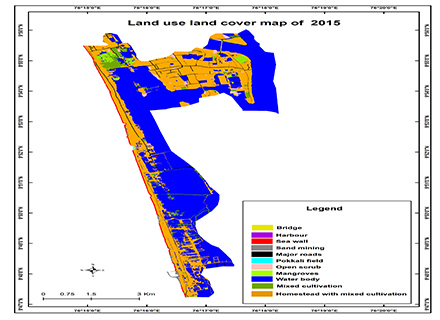
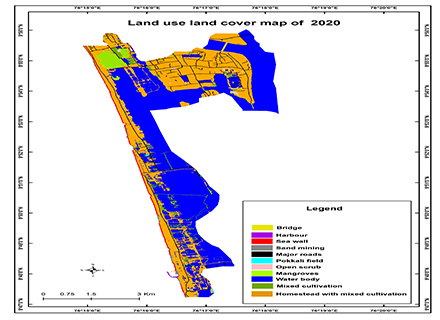
The total area is classified into 6 classes.Water body is the largest area which covers 808.98 ha (76.73% of the study area).The second largest class is Homestead with Mixed cultivation which covers 149.83 ha (14.21 % of the study area).Mixed cultivation is the third largest class which covers 56.83 ha (5.39 % of the study area).The classes identified and the respective area for the year 1986 to 2020 The Land use /Land cover change analysis of Chellanam during 1986 to 2000 using Google satellite images shows that 78.19% of the study area is covered by waterbody, 14.05% is covered by homestead with mixed cultivation, 5.742% is covered by mixed cultivation.The Land use /Land cover change analysis of Chellanam during 1986 to 2015 using Google satellite images shows that 76.75% of the study area is water, 14.19% is covered by homestead with mixed cultivation, 5.39% is covered by mixed cultivation. The Land use /Land cover change analysis of Chellanam during 1986 to 2020 using Google satellite images shows that 76.73% is covered by water body, 14.21%is covered by homestead with mixed cultivation, 5.39% is covered by mixed cultivation.The total mangrove area in 1986 to 2000 Land use /Land cover change analysis was 9.98ha. The Land use /Land cover change analysis of mangroves during 1986 to 2015 &1986 to 2020 shows that mangrove vegetation is increased by 26.7 ha.The total area of major roads in 1986 to 2000Land use /Land cover change analysis was 4.46 ha. The Land use/Land cover change analysis of 1986 to 2015 &1986 to 2020 shows that major road is increased by 7.29 ha.The total area of open scrub in 1986 to 2000 Land use/Land cover change analysis was 6.2ha.The Land use/Land cover change analysis during 1986 to 2015 &1986 to2020 shows that open scrub area is decreased by 4.95 ha.
.jpg)
.jpg)